Why did some cities suffer more from ’08 financial crisis than others?
December 12, 2011 2 Comments
It’s been called the biggest economic crisis since the 1929-39 Great Depression.
Yes, it’s true that there has been a sharp rise in the national unemployment rate since the frightening Fall of 2008, when the sub-prime mortgage crisis evolved into a serious threat to the solvency of the banks to which millions of people had entrusted their savings.
Yet the crisis seemed to by-pass Winnipeg.
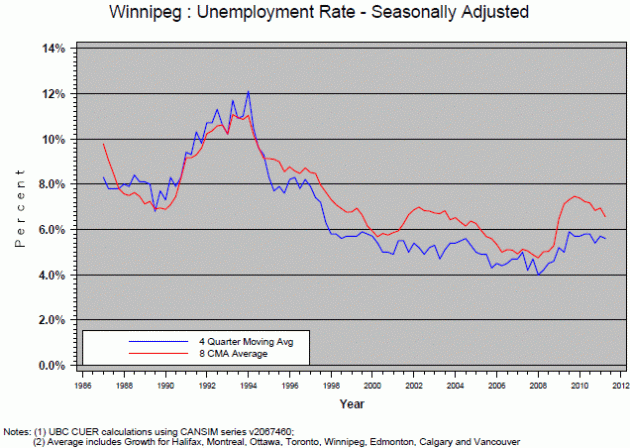
In the midst of the “greatest crisis since the Depression”, the city still boasts a better unemployment rate today than it did in the mid-to-late ’80s boom (when unemployment was in the 8% range), and remains far below what we suffered through in 1992-94, when Winnipeg was afflicted with three consecutive awful years of 10-11 percent unemployment rates.

Winnipeg's unemployment rate since the mid-'80s (© Centre for Urban Economics and Real Estate, Univ. of B.C.)
Other Canadian cities haven’t been so lucky.
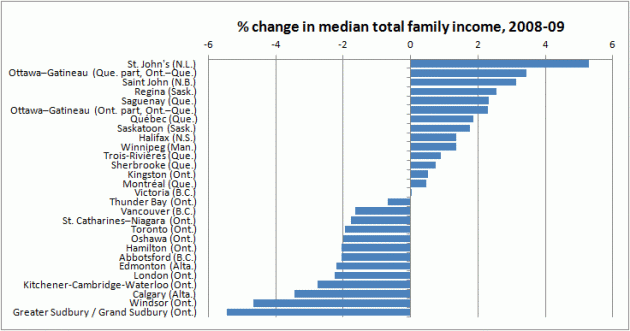
The following chart shows how the median total family income changed in 27 metropolitan areas across the country (28 if you count the Ontario and Quebec parts of metropolitan Ottawa-Gatineau separately, as Statistics Canada does below). In 13 metro areas, the typical family was worse off in 2009 than in 2008.
Why might some cities have been luckier than others?
I revisited an old data file I still have on my hard drive, containing as much data about 25 Canadian cities as I could download from Statistics Canada’s 2006 Census Community Profiles site.
When I entered the 2008-09 percentage change in each community’s median family income, and looked for correlations, an interesting picture began to emerge.*
- The “wealthier” cities took the biggest hit. The higher a city’s typical family income was back in 2005, the more likely that city was to be hit hard by events in 2008-09. Boomtowns such as Calgary and Edmonton, and “auto towns” like Windsor and Oshawa, saw family incomes drop between 2008 and 2009. Cities that were less affluent to start with came through the crisis in better shape.
As higher-income cities tended to have more expensive housing markets, the 2008-09 crisis thus tended to be cruelest to those with the highest monthly mortgage and rental payments. There were also signs that the faster a city’s population grew between 2001 and 2006, the bigger the impact of the crisis.
Note that this should not be taken as a defence of anemic income growth, as even those cities that took the hardest hit remained more affluent afterwards.
- Cities with larger immigrant populations tended to take a harder hit.This probably reflects the tendency for immigrants to flock to cities which are experiencing booms, and to be at a higher risk of being laid off when the economy goes sour.
While continued immigration into Winnipeg from around the world continues to be a good thing — isolated communities in particular need an infusion of new people and new perspectives from time to time — this should serve as a warning that we should use the good times, while they last, to prepare newcomers now so that they have the skills and qualifications to survive a downturn.
- Health care jobs as a shock absorber? Cities with larger numbers of health care workers as a percentage of the local workforce tended to come through the 2008-09 crisis in better shape. Many of these jobs are secure right now thanks to an aging population, and well-paying to boot, so it makes sense that the larger their share of the workforce, the better the community is able to withstand economic shocks.
It’s also worth noting that communities with larger numbers of people employed in “social science, education, government service and religion” — a number of these being university towns and/or smaller provincial capitals — seemed to come through the 2008-09 crisis in better shape, though the correlation is just shy of the cut-off I’ve used here.
* – Pearson correlations of 0.500/-0.500 or stronger. Based on 24 of the 25 cities in my data file, thanks to Statistics Canada’s inconvenient splitting of metropolitan Ottawa-Gatineau into two parts.
Australia, like Canada, has so far come through the global economic crises in fairly good shape — which means that Australians remain prodigious travelers. One of them is the Sydney Morning Herald‘s Ben Groundwater who, with little fanfare, talked his way past border security — suspicious as they are of Australians going to Winnipeg, of all places, on holiday — and dropped in to take a look at our city through a fresh set of eyes.
His candid observations for the benefit of his readers back home in Australia, from the “ghost town” feel of Winnipeg’s strangely empty streets to Osborne Village’s “cool” artistic vibe, is worth reading if you’re interested in getting a grasp on how outsiders view our city and what the “ideal” Winnipeg should be like. (A tip of the hat to James Hope Howard of Slurpees and Murder for bringing this to my attention.)


Recent Comments