What we need to do to get Manitoba moving again: An analysis using R Studio and T-Tests
March 15, 2024 Leave a comment
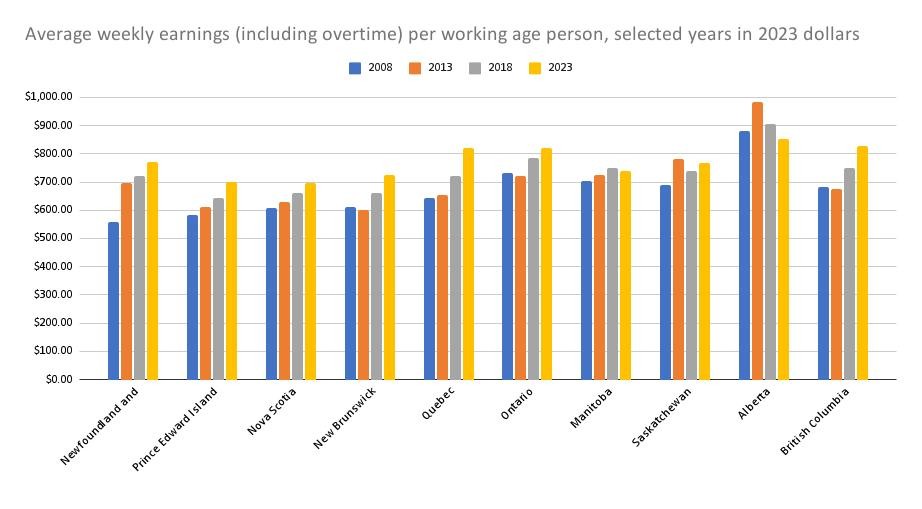
You could be forgiven for thinking that the 2008-09 global economic crisis barely affected Manitoba. If you divided all weekly earnings paid out in July of that year by the working-age population as of July 1, Manitoba was a strong performer: the $521/wk. figure meant we had the second-highest average earnings per working-age person among the 10 provinces, bested only by Alberta at $621.
For a province long used to seeing many of its young people depart for better economic opportunities in Vancouver, Calgary or Toronto, the first decade of the 21st century was a good time to be in Manitoba. From 2001 through 2010, Manitoba’s average earnings per working-age person – or yield, as I like to call it – was either the second- or third-best in Canada almost every year, trailing only Ontario and Alberta. The only exception to this was 2006, when we dropped into fourth place when B.C. briefly overtook us.
However, we dropped more routinely into fourth place beginning in 2011. Except for brief returns to third-place in 2013 and 2018, we went through a gradual decline in our standing at first, then a more precipitous drop into sixth place in 2019 and 2020, and seventh place in each year from 2021 through 2023.
If the saying “people are our most valuable asset” is meant seriously, Manitoba’s declining yield performance compared to other provinces suggests we are using that asset poorly.
To better understand what might be holding back Manitoba’s yields, which will ultimately reduce Manitoba’s quality of life compared to other provinces, I turned to Statistics Canada’s 2021 census profiles. In addition to producing data broken down by province, metro area and census tract, Statistics Canada provides breakdowns by forward sortation area (FSA), better known as the first three characters of your postal code. In 2021, there were more than 1,600 FSAs in Canada. I chose 100 of them at random to serve as a representative baseline group, provided that they had populations of at least 1,000. This ensures that the FSAs used here have sufficient subgroup data, and only eliminates largely industrialized or exceptionally small or remote areas.
I then chose from the remaining FSAs another 200, again excluding those with populations of less than 1,000. This choice was random, except for a qualifier:
- Group A, which I’ll call the “Affluent Zones”, saw average employment earnings of at least $55,000 per working-age person aged 15-64 in 2020. This is on par with the best 15 percent of FSAs.
- Group C (the baseline group above being Group B), which I’ll call the “Deprived Zones”, saw average employment earnings of less than $33,000 per working-age person in 2020, on par with the worst 15 percent of FSAs.
In R Studio, I ran T-tests for each census profile variable, comparing the Affluent Zones to the baseline group, and then another set of T-tests comparing the Deprived Zones to the baseline group. The objective here was to look for averages for both the Affluent and Deprived Zones that were far enough away from the baseline group so as to be extremely unlikely to just be a fluke – a p-value of less than 0.01 and a T-test statistic of either 2.6 or greater or -2.6 or less.
Initially, I look for predictors of success among those who lived in the Affluent Zones and of failure for those who lived in the Deprived Zones. But I quickly realized there was a more striking angle: that who was underrepresented in each zone compared to the baseline group really told the story of how people get ahead or fall behind in life.
The following is a demographic profile of those three groups based on the group averages.

Who tends to be excluded from the Affluent Zones?
The T-test analysis discussed previously shows that the Affluent Zones show an under-representation of various groups which fall into broader educational attainment, career, family structure and immigrant or Indigenous status categories. Thus, these characteristics are almost certainly factors which hold back one’s earning potential and which drag down the average for the entire province and country. These groups include:
- Those in private households aged 25-64 with no educational certificate or diploma. While the average baseline group FSA had 1,352 residents in this category, the average among Affluent Zones FSAs was just 479. The figures for those having completed high school or equivalent were 3,046 and 1,927 respectively.
- Affluent Zones were on average home to half as many people with apprenticeship or trades certificates or diplomas aged 25-64 as in the baseline group, 610 versus 1,221 on average respectively.
- Those aged 25-64 with training in certain backgrounds were underrepresented in the Affluent Zones compared to the baseline group. These include culinary, entertainment and personal services (176 versus 288 on average), mechanic and repair technologies technicians (154 versus 290), and the construction trades (277 versus 435).
- Those working in industries such as manufacturing (610 on average versus 1,062) and health care and social assistance (1,299 versus 1,749) or accommodation or food services (558 versus 780) were less likely to be found in the Affluent Zones compared to the baseline group.
- Affluent Zones have disproportionately few one-parent family households (642 on average, versus 975 in the baseline group).
- Affluent Zones on average only have about half as many foreign-born residents who arrived in Canada between 1980 and 2021 as refugees (479, versus 990 in the baseline group). The same was true of those who arrived in Canada as family-sponsored immigrants (1,058, versus 1,894 on average for the baseline group).
- Affluent Zones tend on average to have fewer people who are of exclusively Indigenous ancestry (167 on average, versus 423 for the baseline group).
Who tends to be excluded from the Deprived Zones?
- Deprived Zones have disproportionately few people with a proper education. For example, while the average baseline group FSA had 12,452 25-64s with a high school diploma or equivalent, this average only stood at 8,426 for Deprived Zone FSAs. The same pattern could be seen for apprenticeship certificates among the total population aged 15 years or over (1,242 on average in the Deprived Zones versus 1,717 in the baseline group) and bachelor’s degrees or higher (3,311 versus 6,257 for the baseline group).
- Those in professional careers also tend to be underrepresented in the Deprived Zones. For example, the average number of people employed in professional, scientific and technical services is far lower in the Deprived Zones (541) than for the baseline group (1,220). The same is true for employment in finance and insurance (306 versus 679, respectively) and information and cultural industries (150 versus 325).
- Deprived Zones tend to have an under-representation of certain family forms. Couple-family households are less common in Deprived Zones than they are in the baseline group (3,339 versus 5,291 on average respectively), as are married-couple families with children (1,707 on average in the Deprived Zones versus 2,588 in the baseline group). Deprived Zones also had smaller numbers of married people on average (6,689 versus 9,885 for the baseline group) or living common-law (1,715 versus 2,504).
- Employment tends to be lower in the Deprived Zones. This averaged 8,263 in 2021 for the Deprived Zones versus 12,096 for the baseline group.
- Deprived Zones have a markedly lower number of Canadian citizens, due to a larger number of newcomers. This averaged 16,798 in these FSAs versus 23,014 for the baseline group.
What it means for Manitoba
- A recurring theme here has been the importance of a good education. Manitoba has been a poor performer in this regard, with only 59 percent of 25-64 year olds having ever completed a post-secondary degree or diploma. Compare this to B.C., where the figure is 66 percent, or Ontario at 68 percent, and you can see that Manitoba is an unattractive place to do business if you need a skilled workforce. A quality education is vital to decreasing the proportion of the province that constitutes Deprived Zones, and increasing the proportion made up of Affluent Zones.
- Certain careers show signs of dragging down the average due to lower earnings. These include such fields as culinary, entertainment and personal services, mechanic and repair technologies technicians, the construction trades, manufacturing, health care and social assistance and accommodation or food services. Some of these areas, ironically, have also been claiming labour shortages. These fields cannot be allowed to expect to have it both ways, offering noncompetitive wages and working conditions and yet having easy access to talent, and should not see the government come riding to their defence if they attempt to do so. Either the wages need to rise to the level needed to attract people, or these fields need to find their own solutions.
- The family form has a profound effect on the prospects for a good life. People who live in stable families, even if this only comprises a couple without children, have greater freedom to pursue economic opportunity. Those in single-parent family situations do not have as much freedom, and might be required to take less lucrative work to suit their needs. This drags down average earnings. Public policy should show an overt “careers before children” bias, encouraging young people through the education system to be career-minded from an early age, and to move on to family-building once their career is under way.
- Indigenous peoples and newcomers are disproportionately likely to end up as low-income earners, and this in turn depresses yields. If Manitoba is to prosper in the future, it absolutely must act aggressively to get both groups on an upwardly mobile path starting with education. Access to further education without financial sacrifice should be available for all age groups, not just the young. As well, neither newcomers nor Indigenous peoples should be relegated to the role of “cheap help”, as has been alleged of the Temporary Foreign Worker Program. Newcomers arriving in Manitoba should either be targeted for their professional skills that will translate into immediate average-earnings and GDP per capita growth, or be targeted for upgrading assistance. In certain cases, it might also be necessary to diplomatically but firmly push back on gender-role expectations that might particularly keep women out of the workforce or encourage them to aim low.


Recent Comments